
With the rise of online synchronous learning at two-and-four year institutions, data-driven instruction is making a difference for students, especially as an interventionist method offering learner support.
Student data analytics provide educators with new tools and insights to track and improve instruction. A recent professional survey from Inside Higher Ed reports that 74% of Chief Instructional Officers use data to support student success.
If you’re a higher education instructor or administrator not yet using student data analytics to support students in need, you should be.
Data can make a difference as a pathway for learner support. To identify students who need help staying on task or with engagement–their data tells a story with the right tools to capture it.
Jump To:
Data is no stranger to education.
Educators have long used data to measure impact and student success. Grade books and standardized tests, for example, have been cornerstone methods that offer insights to enrich curriculum, identify problem areas, and assess program impact at scale.
But while data in higher education isn’t a new phenomenon, the story with data today is different. Namely, remote learning offers more than a flexible future of multi-modal education. Online synchronous provides new touch points and metrics to evaluate students, especially at the instructional level.
Online learning platforms aggregate student and classroom data more efficiently and with new inputs. And while hybrid, HyFlex, and fully remote enrollment rise–with more than 60% of institutions offering multi-modal instruction on campus–online student data offers an increasingly relevant analysis touchpoint for a growing subset of students today.
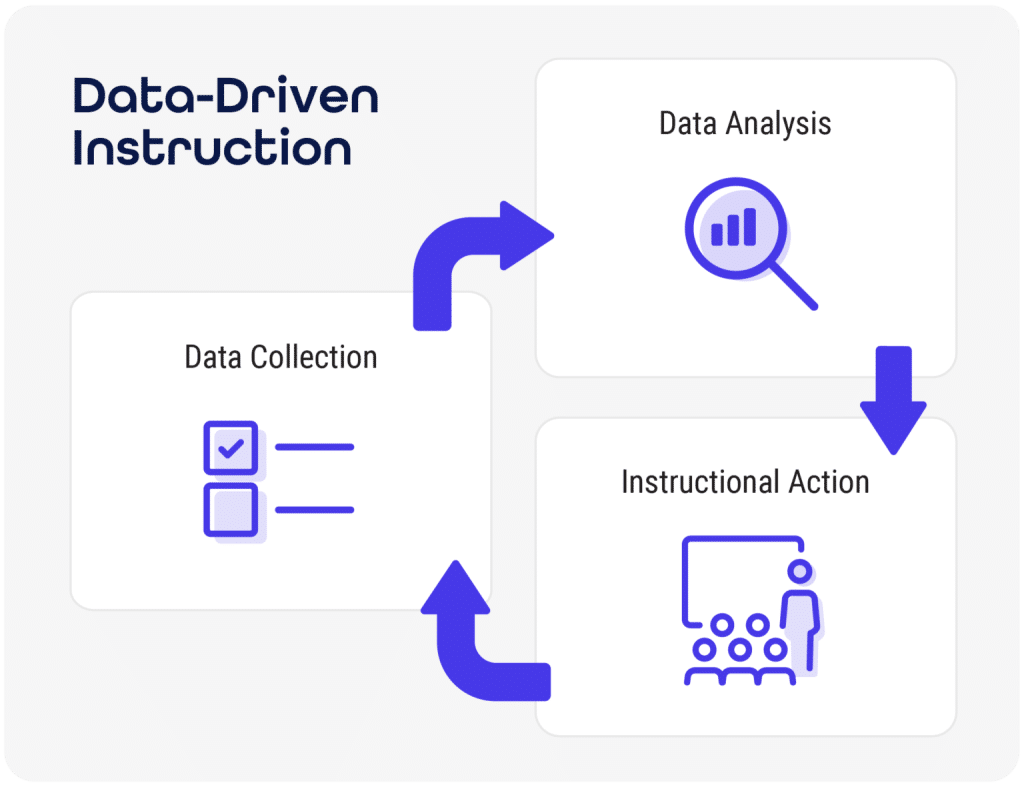
Data-driven instruction is a dynamic between student inputs, analysis, and instructor outputs. It’s an iterative approach to instruction that focuses on making calculated adjustments to improve student success and the impact of instruction.
To incorporate data analytics into your practice, understand how to iterate. Here’s a three-step sketch of data-driven instruction at the implementation level.
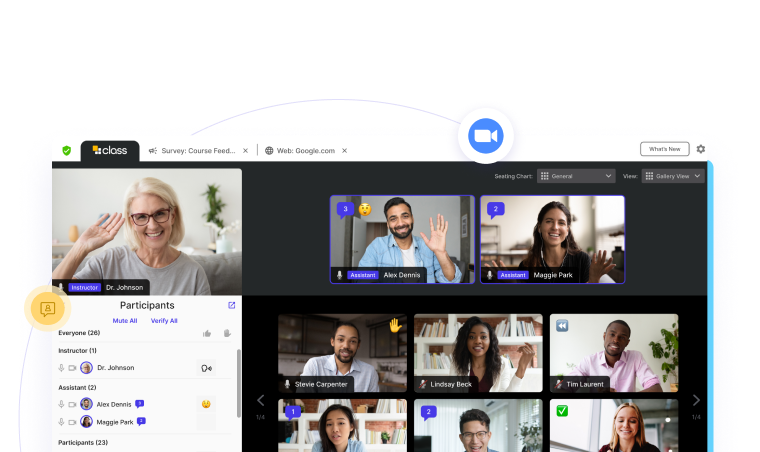
With the rise of online learning technology, e-learning platforms–like Class.com’s data dashboards–collect, aggregate, and display engagement and performance data efficiently at scale. These platforms include new outputs–like talk time, attendance, and participation–from live synchronous sessions.
It’s not enough to collect data; instructors must examine it. Critically thinking about data crystalizes views of students to track performance, engagement, and instructional effectiveness.
Did your analysis provide insights? If so, put them into practice. Consider what’s working–or not–and where there are gaps. Then, create actionable insights to improve instruction, offering data-driven support for individual learners.
The widespread availability of data–and mining it for insights–changes how institutions build programs, inform administrative decision-making, and conduct live instruction.
Data dashboards are a valuable tool for teaching an online class. Quick views of detailed classroom performance illuminate how students are doing. Use data to identify gaps and consider the next steps for improvement.
Data informs student success at all levels of your institution, from students to administrators to instructors. Here’s a breakdown of how your whole campus can use data to inspire success.
Instructors: Deepen understanding of student engagement. Understand which of your students is the least engaged to the most talkative. Track attendance rates or fluctuations in performance over time. Dive into the statistics; it’s all in the details.
Administrators: If your institution has recently transitioned part or all of its courses to online learning, use data across classes to assess curriculum and system-wide changes. If a certain subset of students is fairing better than others (transfers vs. formerly in-person), consider what changes might balance the scale. Collect semester-long data for holistic views on impact.
Students: If your students are learning in a hybrid, HyFlex, or fully remote classroom, empower them to assess themselves. Share dashboard insights in private one-on-ones or with the class as a whole. By making their participation visual and transparent, you encourage them to take active roles in improvement.
Once you have data, you must decide what to do with it.
While there are many ways to use data to enhance instruction, student support and intervention offer an equitable approach to improving success rates in online courses. In this domain, use data to identify learning gaps in the curriculum or on a case-by-case basis with students.
Need intervention ideas? Here are ways faculty might consider incorporating data-driven insights to support learners in need.
Identify students failing behind, disengaging, or missing classes: monitor attendance trends, grade performance over time, and participation in live sessions.
Figure out what inspires them to re-engage. Assess their relationship to the subject matter or whether the readings are compelling. Suggest 1-1 office hours or other asynchronous check-ins. Use data to assess improvements.
For online synchronous, engagement makes the difference for an effective online course. If engagement data is trending downwards, it might be time to change it up.
Set bi-monthly check-ins of your data dashboard. Figure out which direction your class is trending. If it needs to be re-engaged, try changing up breakout room pairings. Change up activities or content formats. Additionally, share data with the whole class and set a talk time standard.
If your institution is making big campus-wide changes–like overhauling curriculum offerings of a program or implementing new instructional modalities–use data to help track the impact.
Create data subsets to gather the insights you need. Monitor student performance across departments, grade levels, or enrollment types (transfer, in-person, fully remote). Find out where your gaps are–and address them.
Collect data over a semester to assess your curriculum. Trends in engagement and grade performance could reveal where students become disengaged or have difficulties. Use the data to make adjustments for the semester ahead.
Here are some best practices to keep in mind when using data to inform decision-making.
Consider low-stakes assessments (surveys, polls, and quizzes) to boost engagement in acute moments of class. This can help inform subject matter comprehension to determine if your class is ready to move on to the next discussion. Additionally, use reflective teaching methods to engage with students in need directly. This includes asking them directly how they can assess their performance or evaluating the data together to surmise what’s causing the engagement drop-off. Lastly, monitor historical data to make adjustments in semesters ahead. This can give you a view of your instruction’s effectiveness beyond individual students.
While student data changes how instructors and administrators support student outcomes, Class.com is building a future of education in which data makes a difference.
Our analytics dashboard provides instructors with the information they need to make data-driven decisions on behalf of their students.